
Sales Forecasting AI Challenge
Predict Volume, Price and Sales using a given dataset.
Challenge

Welcome to the Sales Forecasting AI Challenge!
There are numerous advanced tools and techniques are employed for data analysis such as vision techniques, Natural Language Processing (NLP), data analytics, Internet of Things (IoT) , and many more. One of the techniques frequently preferred for analysing financial data is statistical Time Series Analysis. The ability to predict sales or prices of stock based on the current statistics is almost need of every company these days. You are required to build a model to predict sales and volume of the respective agencies mentioned in the data. You may build a single model or a cluster of models using either statistics, deep learning or other machine learning techniques.
The dataset consists of single train file "train.csv" which contains the fields "YearMonth" (Financial year), "Agency", "SKU", ..... The dataset also contains the redundant fields and NaN values that the participants have to identify. Most of the fields name are self-explanatory.
Sample Data:
Agency, SKU, YearMonth, Volume, Price, Sales, Promotions, Avg_Max_Temp
0, 22, 1, 2013-01-01, 52.27, 1168.9, 1069.17, 99.74, 25.85
1, 22, 4, 2013-01-01, 31.06, 1742.11, 1598.41, 143.7, 25.85
Data Source
Volume Forecasting: SKU future volume analysis and prediction
NOTE: The Submission Guidelines have been updated for this challenge to support Auto-Grading, now you may immediately see your score on the Leader Board.
The score is displayed in reverse order of Root Mean Square Error (RMSE). "Train.csv" file contains the data required for training.
The output of the model should be "output.csv" containing the following columns in this exact order:
- YearMonth
- Agency
- Volume
- Price
- Sales
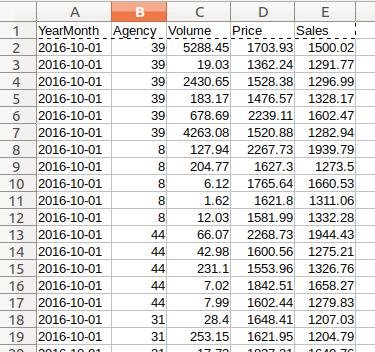
To ensure the consistency of the YearMonth and Agency attributes, as their values must be same for correct evaluation, a "partial.csv" is also provided which contains the exact values and order of the "YearMonth" and "Agency" attributes. Required prediction values for this challenge are "Volume", "Price" and "Sales" which may be inserted in the same file and be submitted for evaluation. A sample screenshot is also provided below to help understand the outlook of the the final file.
...
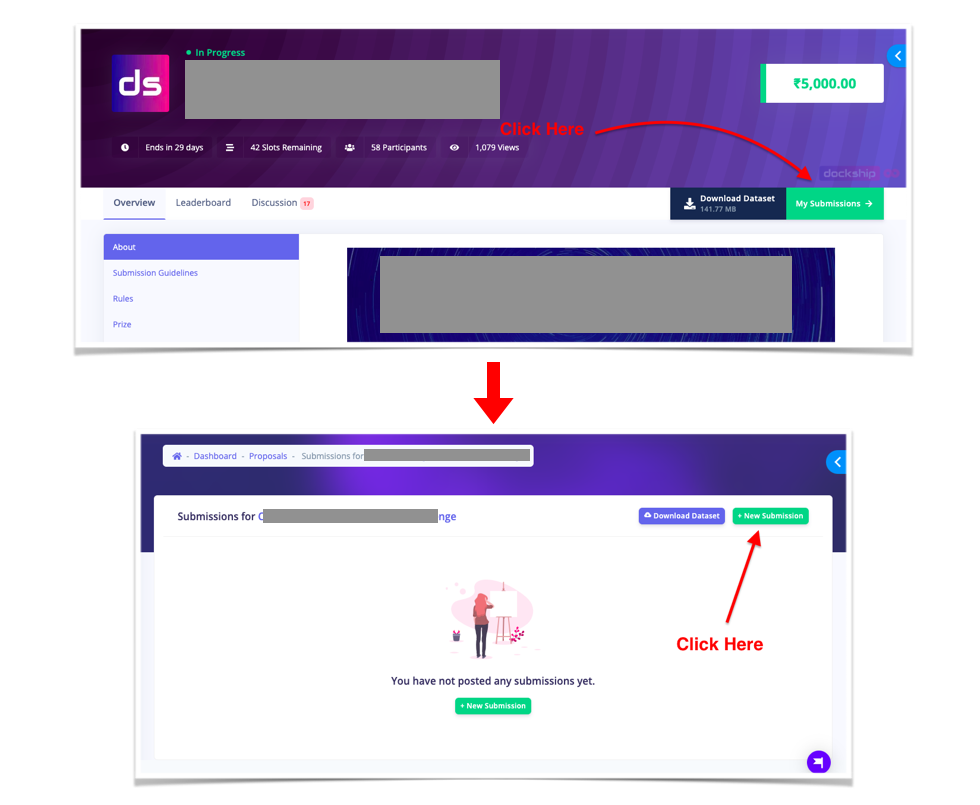
How to make a submission?
- Click on "My Submission"
- On the next page, click on "+ New Submission"
- Upload your CSV in the next page and click on "Submit for Review"
Please note:
- You must submit your CSV file by uploading the CSV in the "My Submissions" section of this challenge.
- Your submission will be auto graded and you will be able to see your results instantly.
- If there is any error in the submission, your final score will be marked as 0.
Judgement
- Root Mean Squared Error (RMSE) will be used for evaluation
Rules
- Submission must not include copyrighted code. If violation is found, submission will be rejected.
- The submission should be in a proper format as described by "Submission Guidelines".
- Late submission will not be accepted beyond provided deadline (Indian Standard Time).
The Top 3 participants will receive goodies from Dockship.
The goodies will include:
- T-shirt
- Premium Laptop Bag
- Personalized Mugs
- Personalized Notepads
- Laptop Stickers
The top 3 participants will also get Certificates from "Pingzee Technologies".
Challenge Started
